Roadmap — Product design and branding for Reporter, an MVP for Roadmap 2.0.
Roadmap is an enterprise-scale project management tool focused on integrating with existing tools and exception-based management.
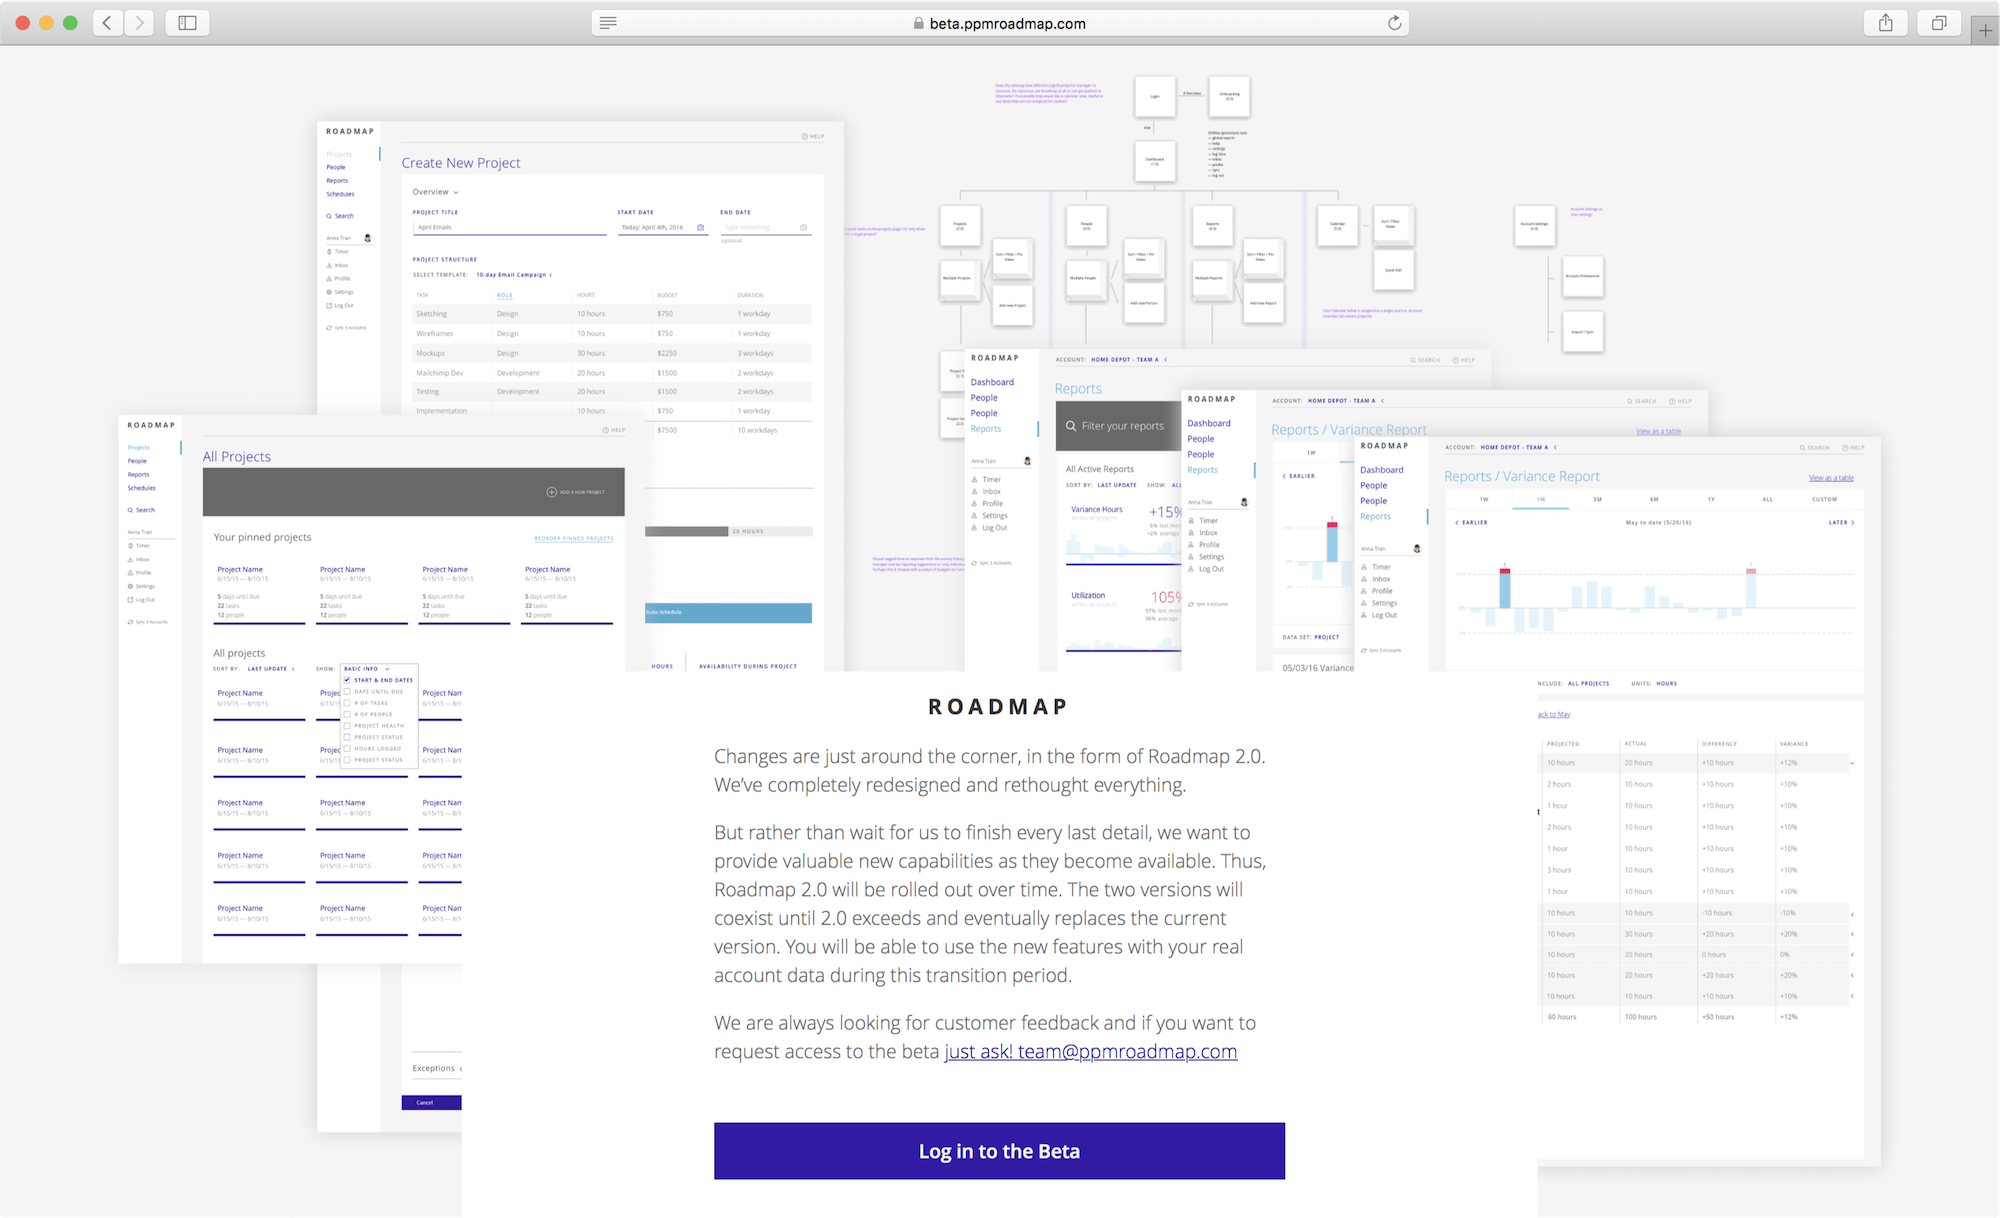
We joined the small team during the summers of 2015 and 2016 to help reimagine Roadmap from the ground up, from both a design and technology perspective. After interviewing different types of customers about their project workflow and about how they use Roadmap, we found what worked and didn’t work about the current release of Roadmap. It became clear that a simpler point of view, better user experience, and a more flexible and easily adoptable tool were essential to satisfy and expand the user base. Because all of these improvements required sweeping changes to Roadmap 1.0, we needed a strategy for slowly rolling out Roadmap 2.0. We developed Reporter as an MVP for Roadmap 2.0 in order to begin that transition.
Integrations
The primary value of Roadmap is collecting data from a variety of tools (Github, Trello, Jira, Basecamp, …) into a single view. A Roadmap customer is often a single administrator or team leader and can use Roadmap to view data from the myriad of tools their team uses day-to-day without asking their team to adopt a new tool.
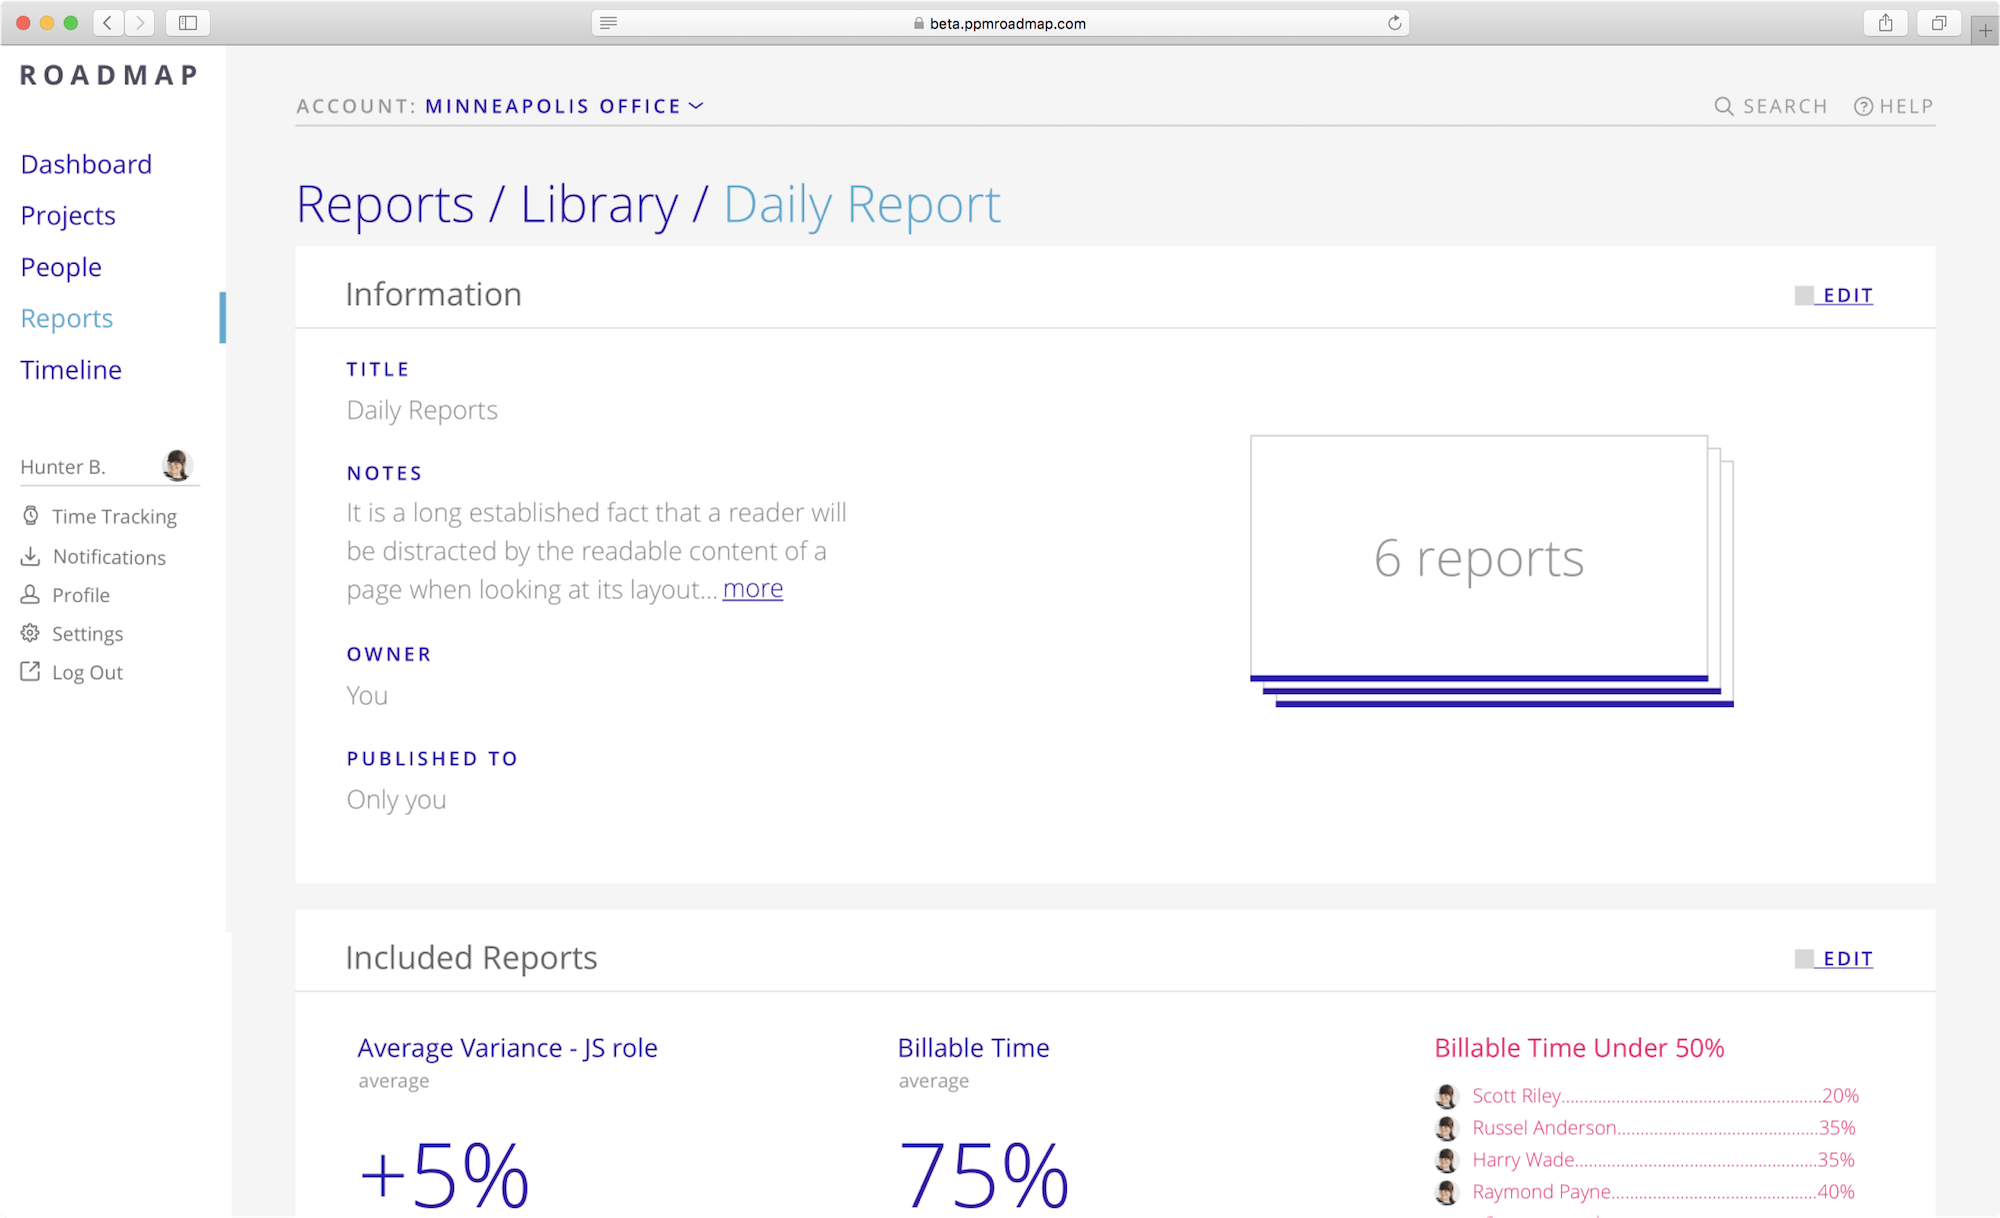
Reports
A Report is a structured comparison of hours, workdays, or dollars across projects, people, tasks, or roles. This allows a user to analyze past data, measure progress, and forecast the future, which enables faster, better decisions.
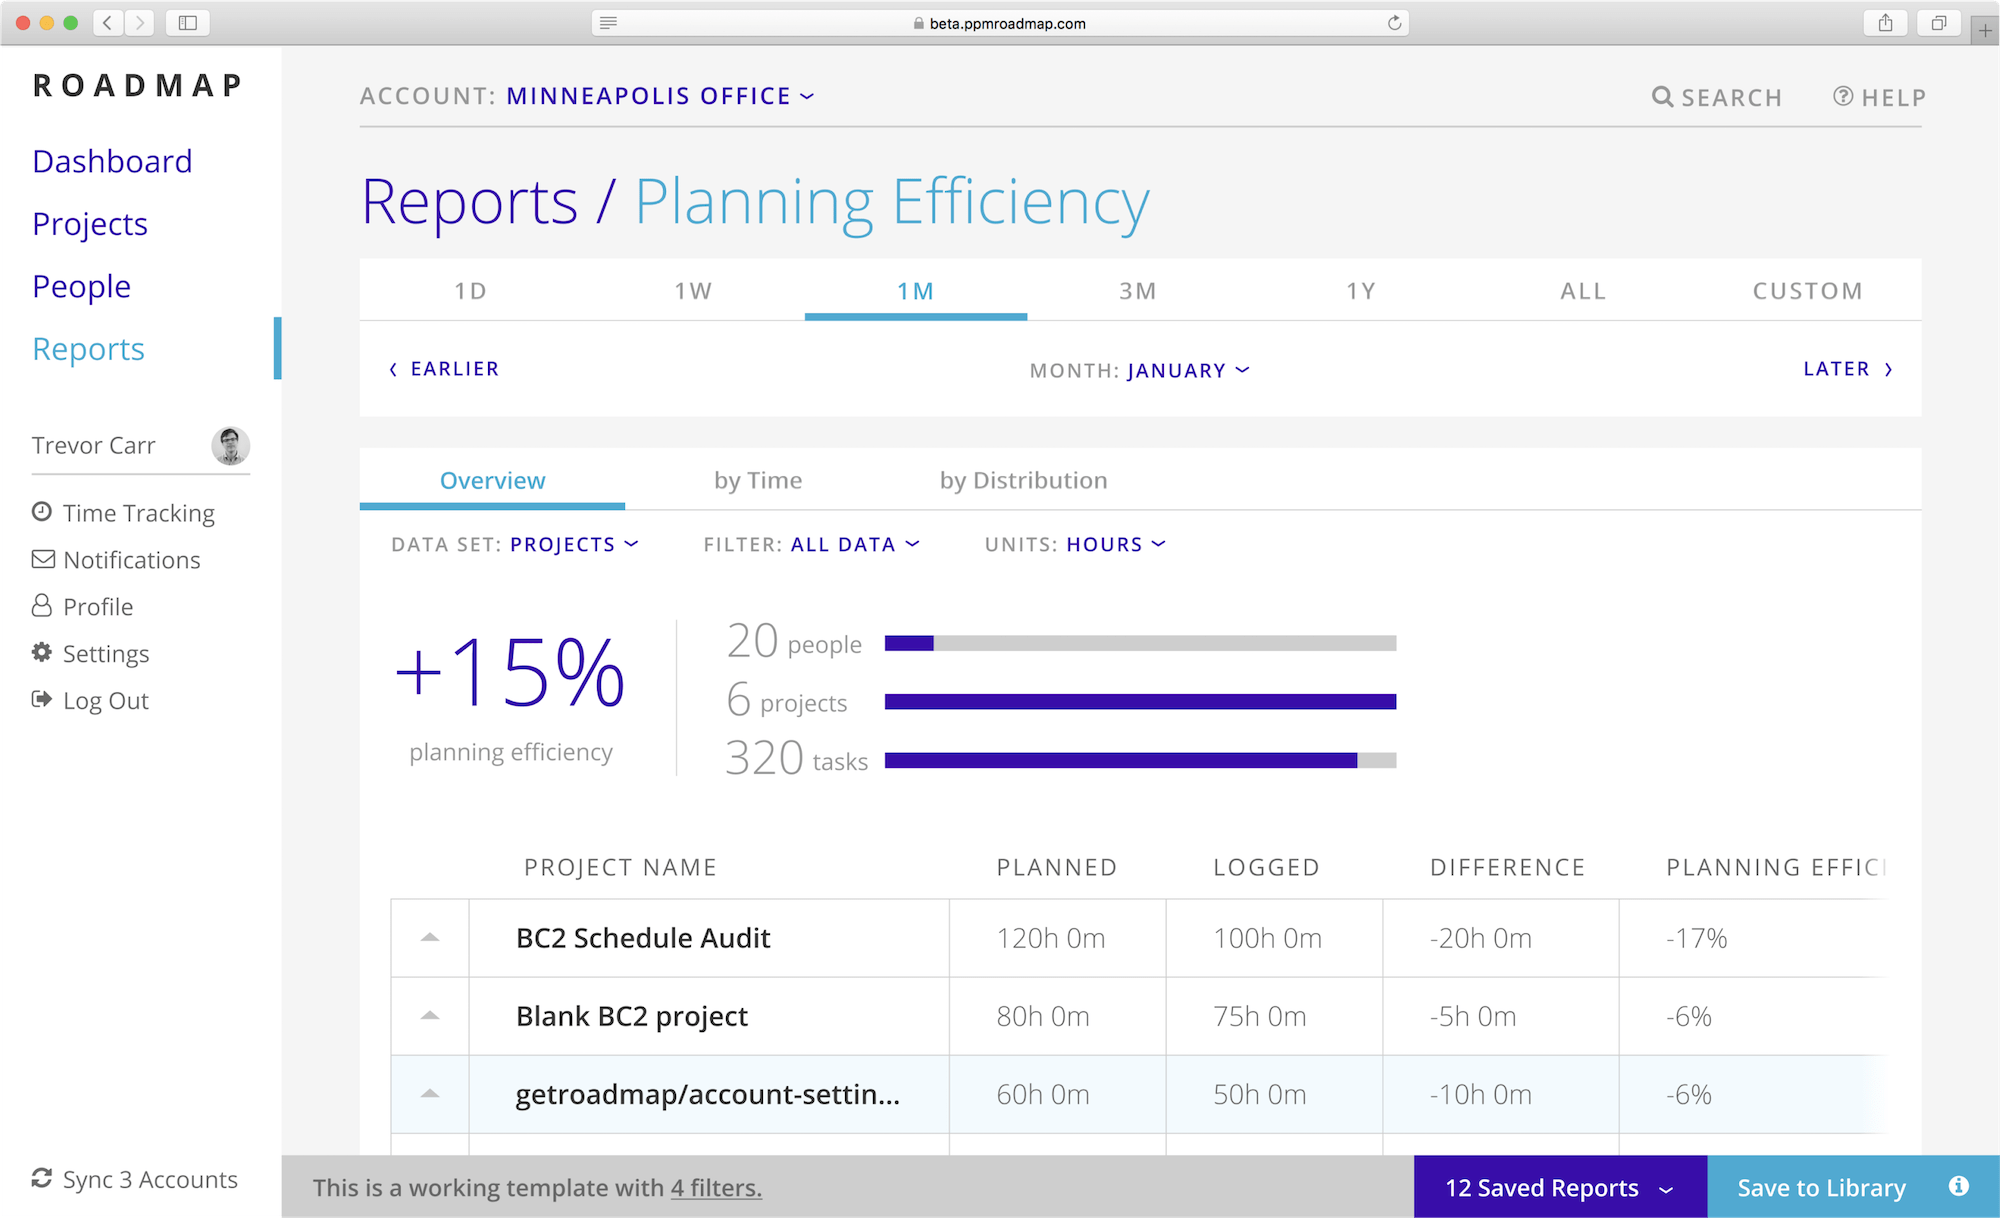
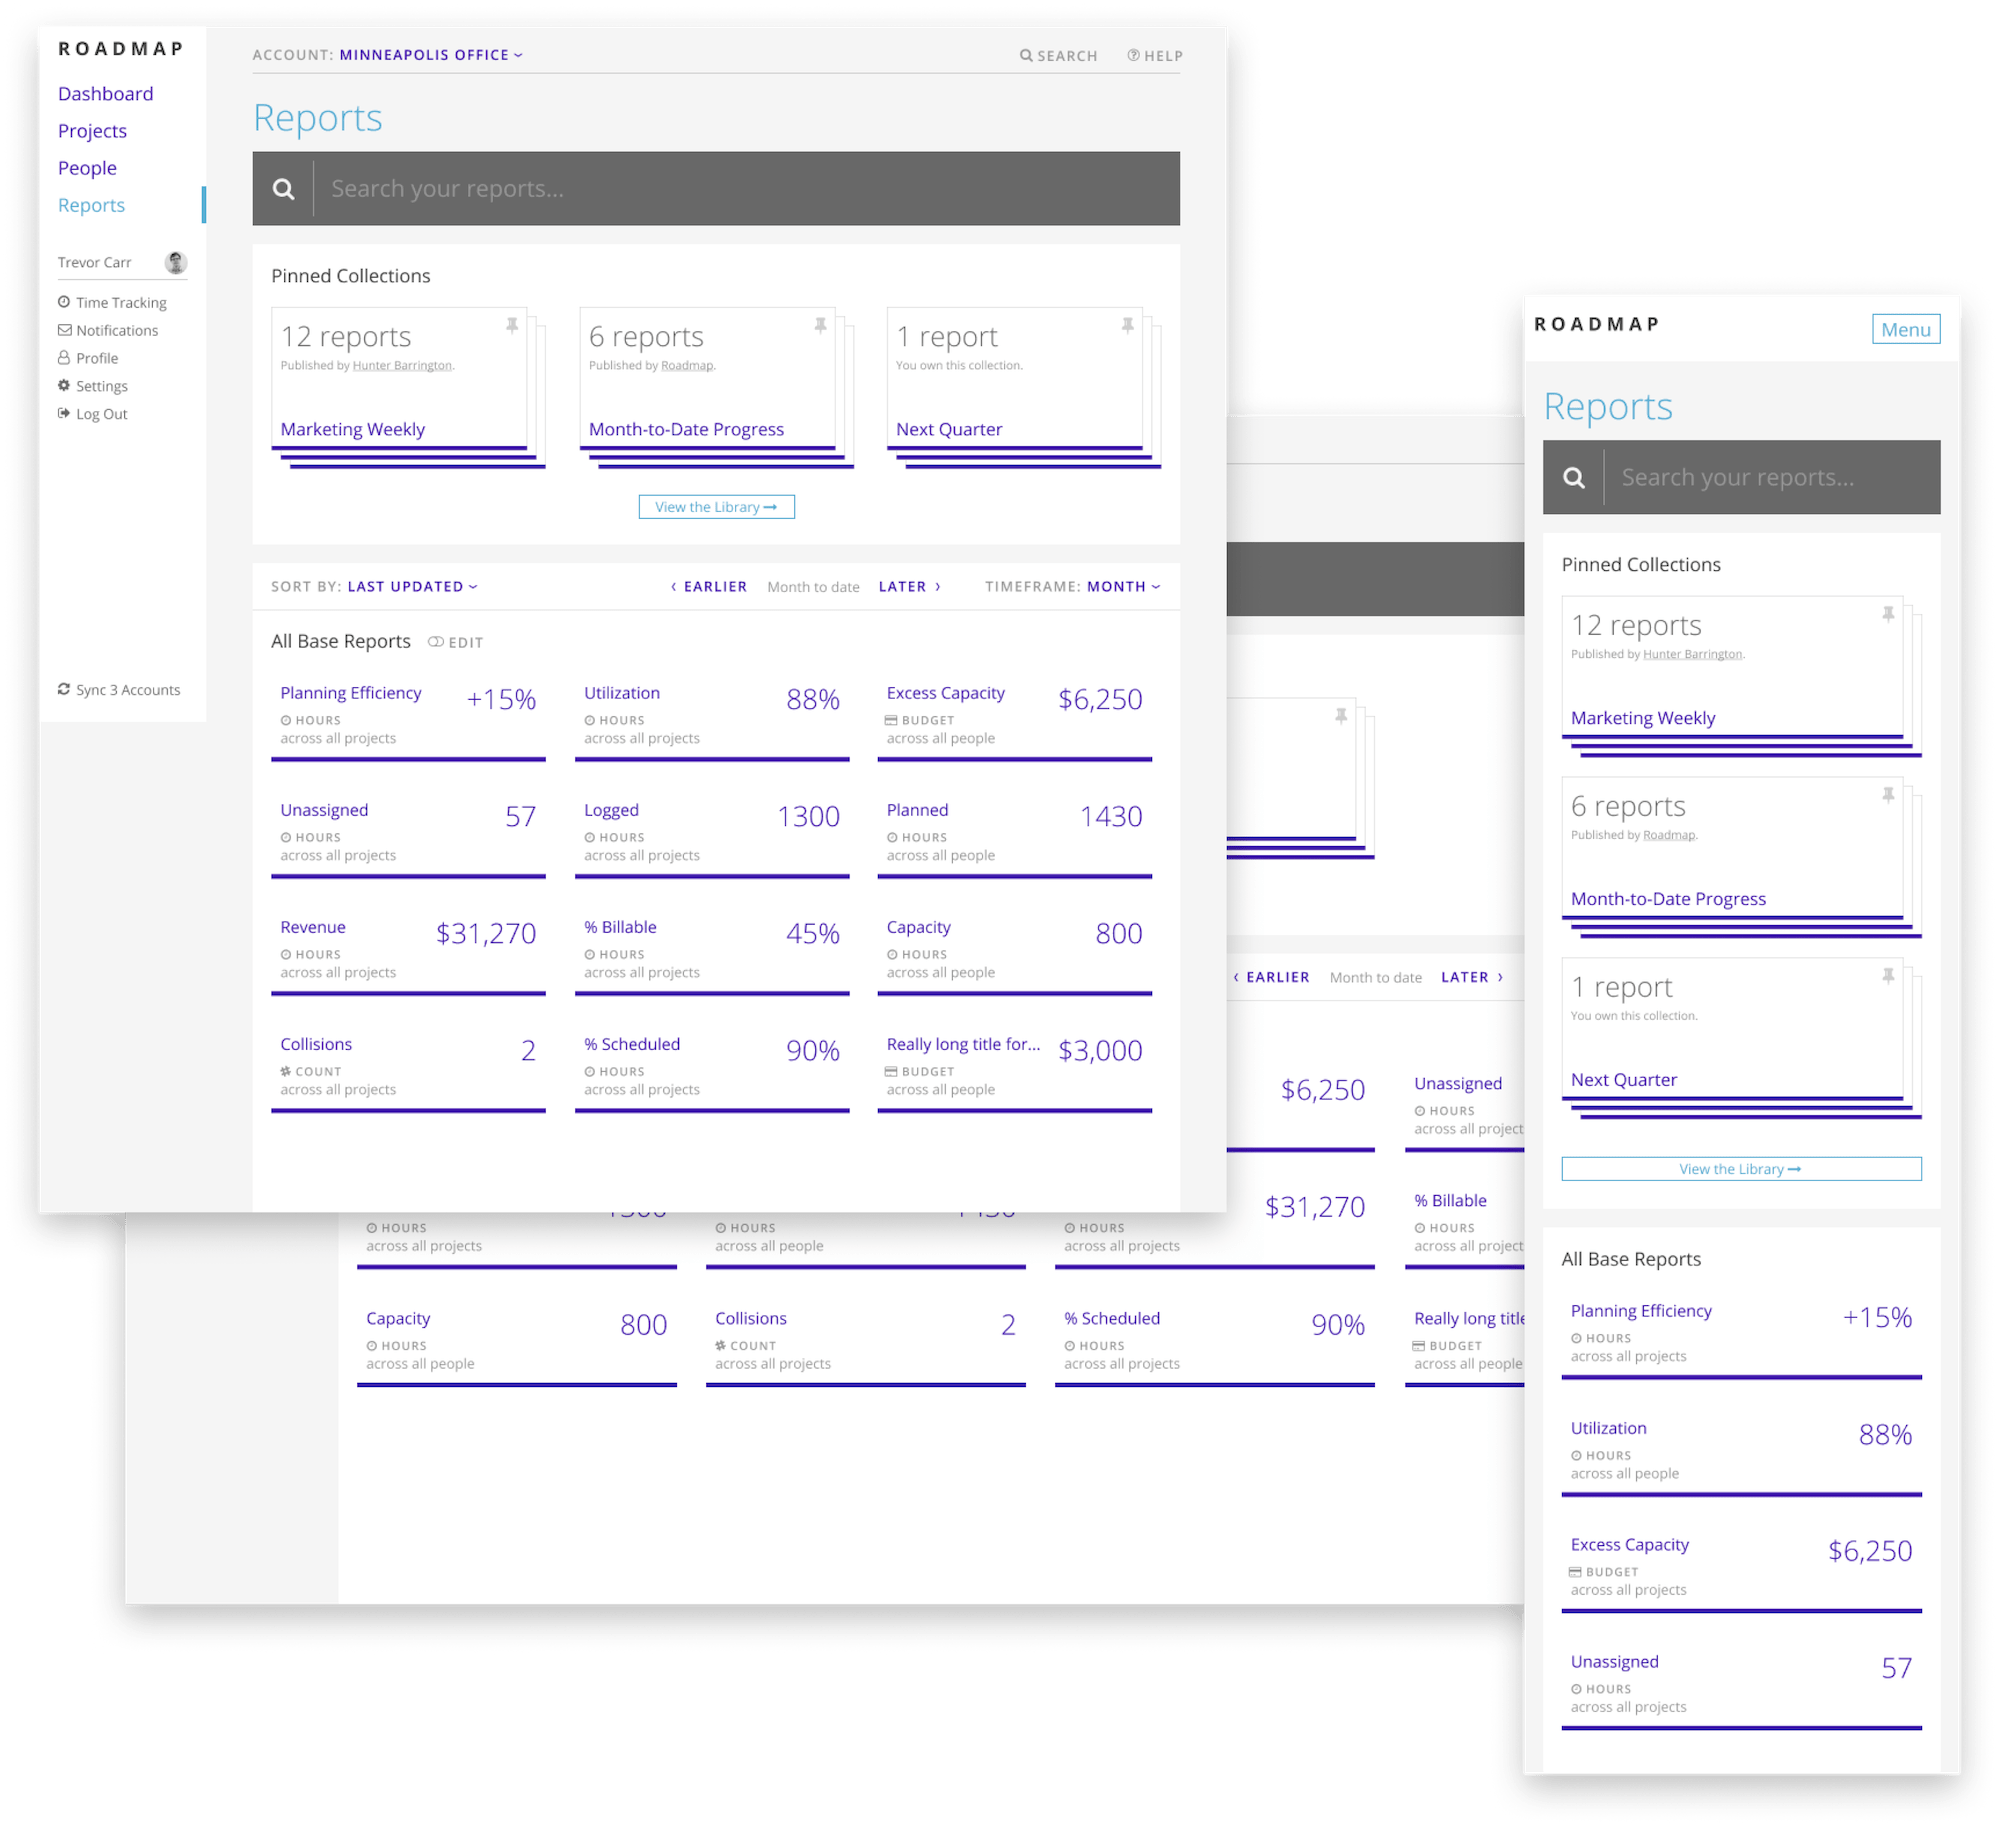
Base Report
Base reports are the core unit of Reporter. Their goal is to provide clear and useful information in a flexible way. A base report comes with a primary data set: Planning Efficiency, Utilization, Project Status, Revenue, Collisions, as well as a series of data columns (logged hours, planned hours, etc). A base report has different views: overview, by time, by distribution, can be viewed across different data sets (hours, work-day, budget dollars) and can be navigated across time and time resolution (week, month, …).
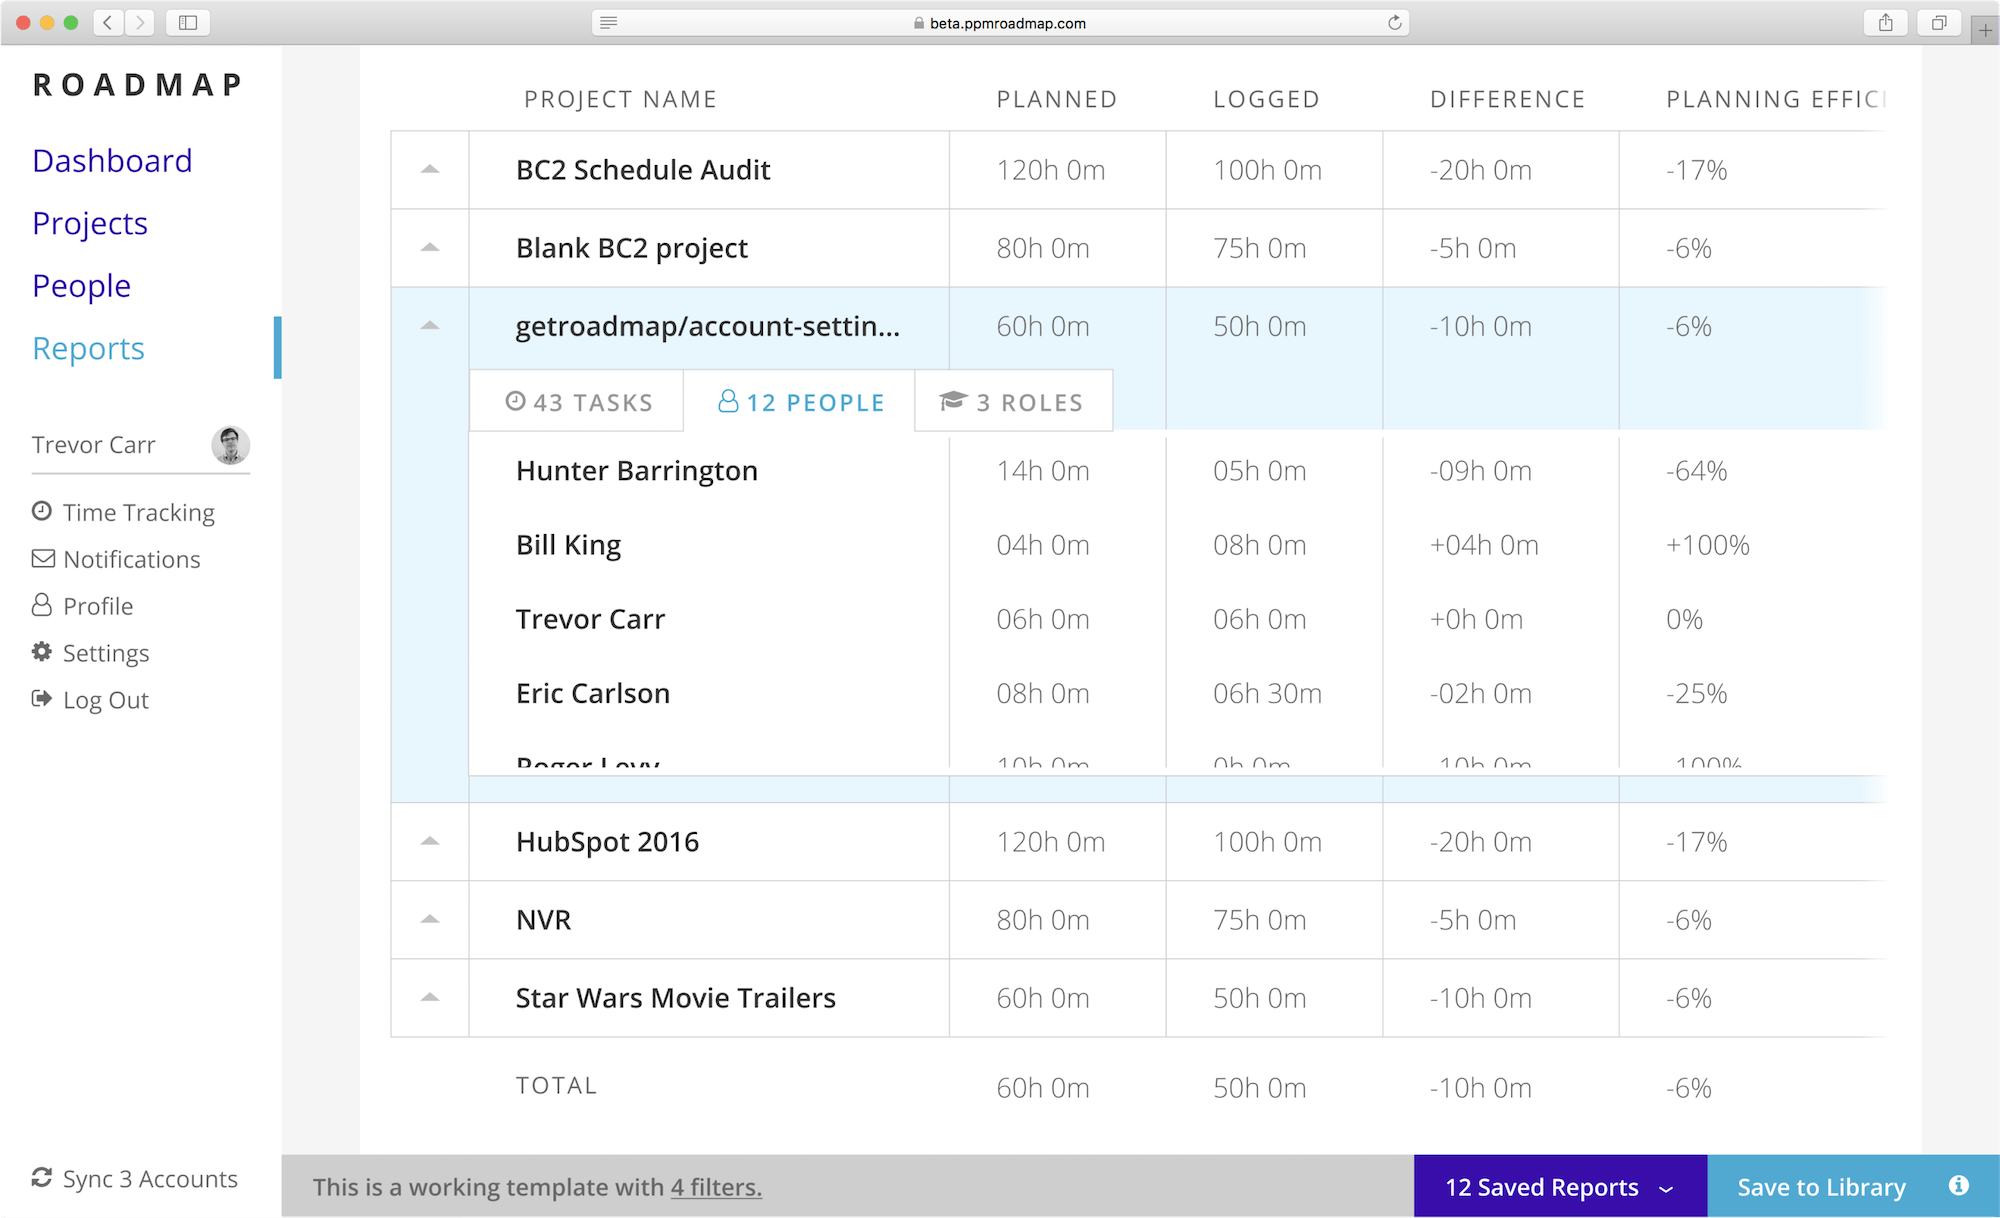
Hide peripheral information
We designed Reporter with the perspective that targeted information is better than complete information, as long as there is easy navigation to ask for contextually related data. A project expands to see the internal tasks, people, and roles. A row can be expanded to view its contributing factors.
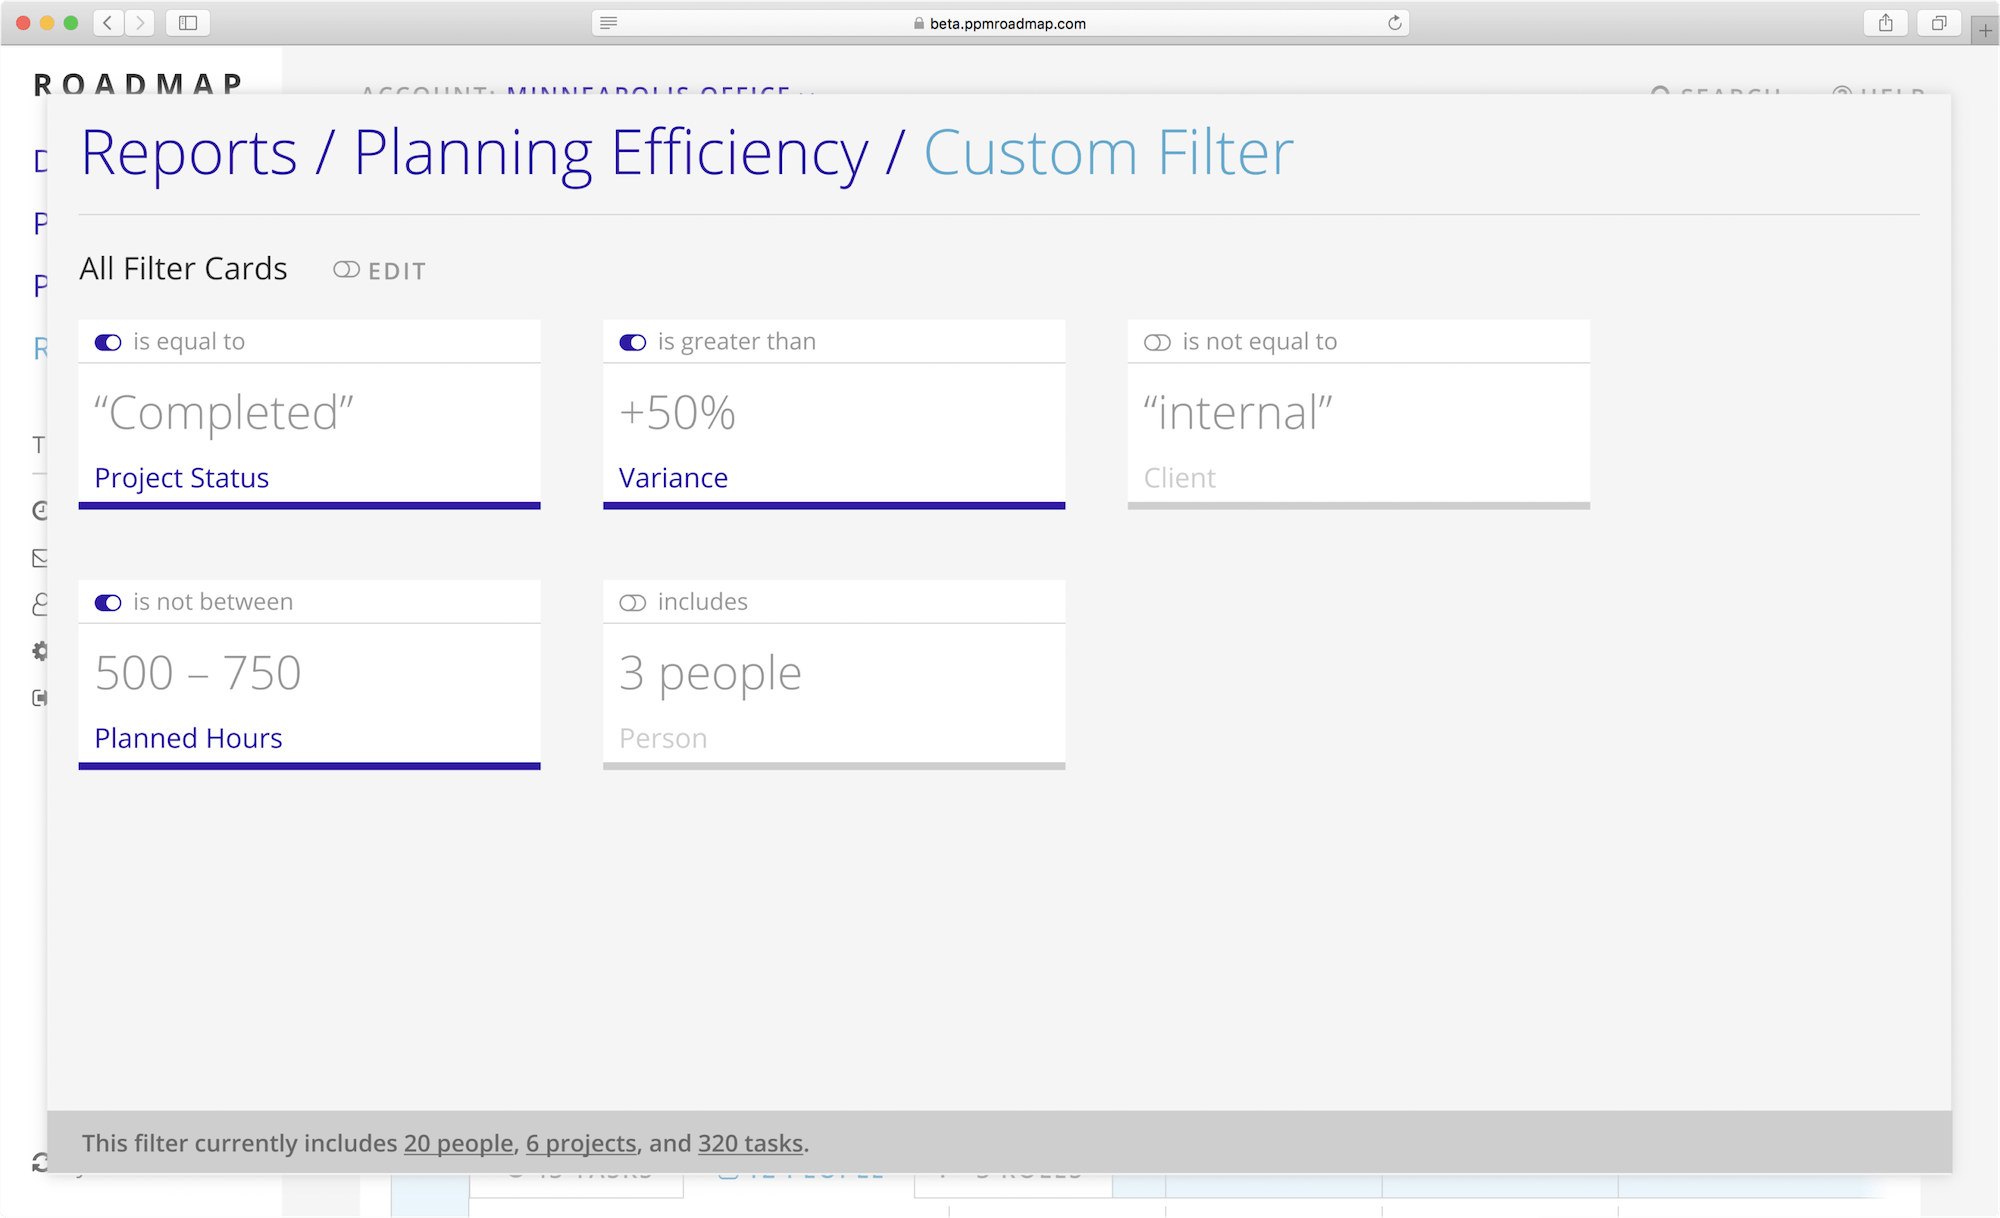
Saved Reports & Filters
A base report can be saved with a relative timeframe, optional filters, a custom name, and is collapsed into a small card. Rather than spending time organizing a large table view each time you open Roadmap for a particular task - Saved Reports allows a single setup that can be returned to.
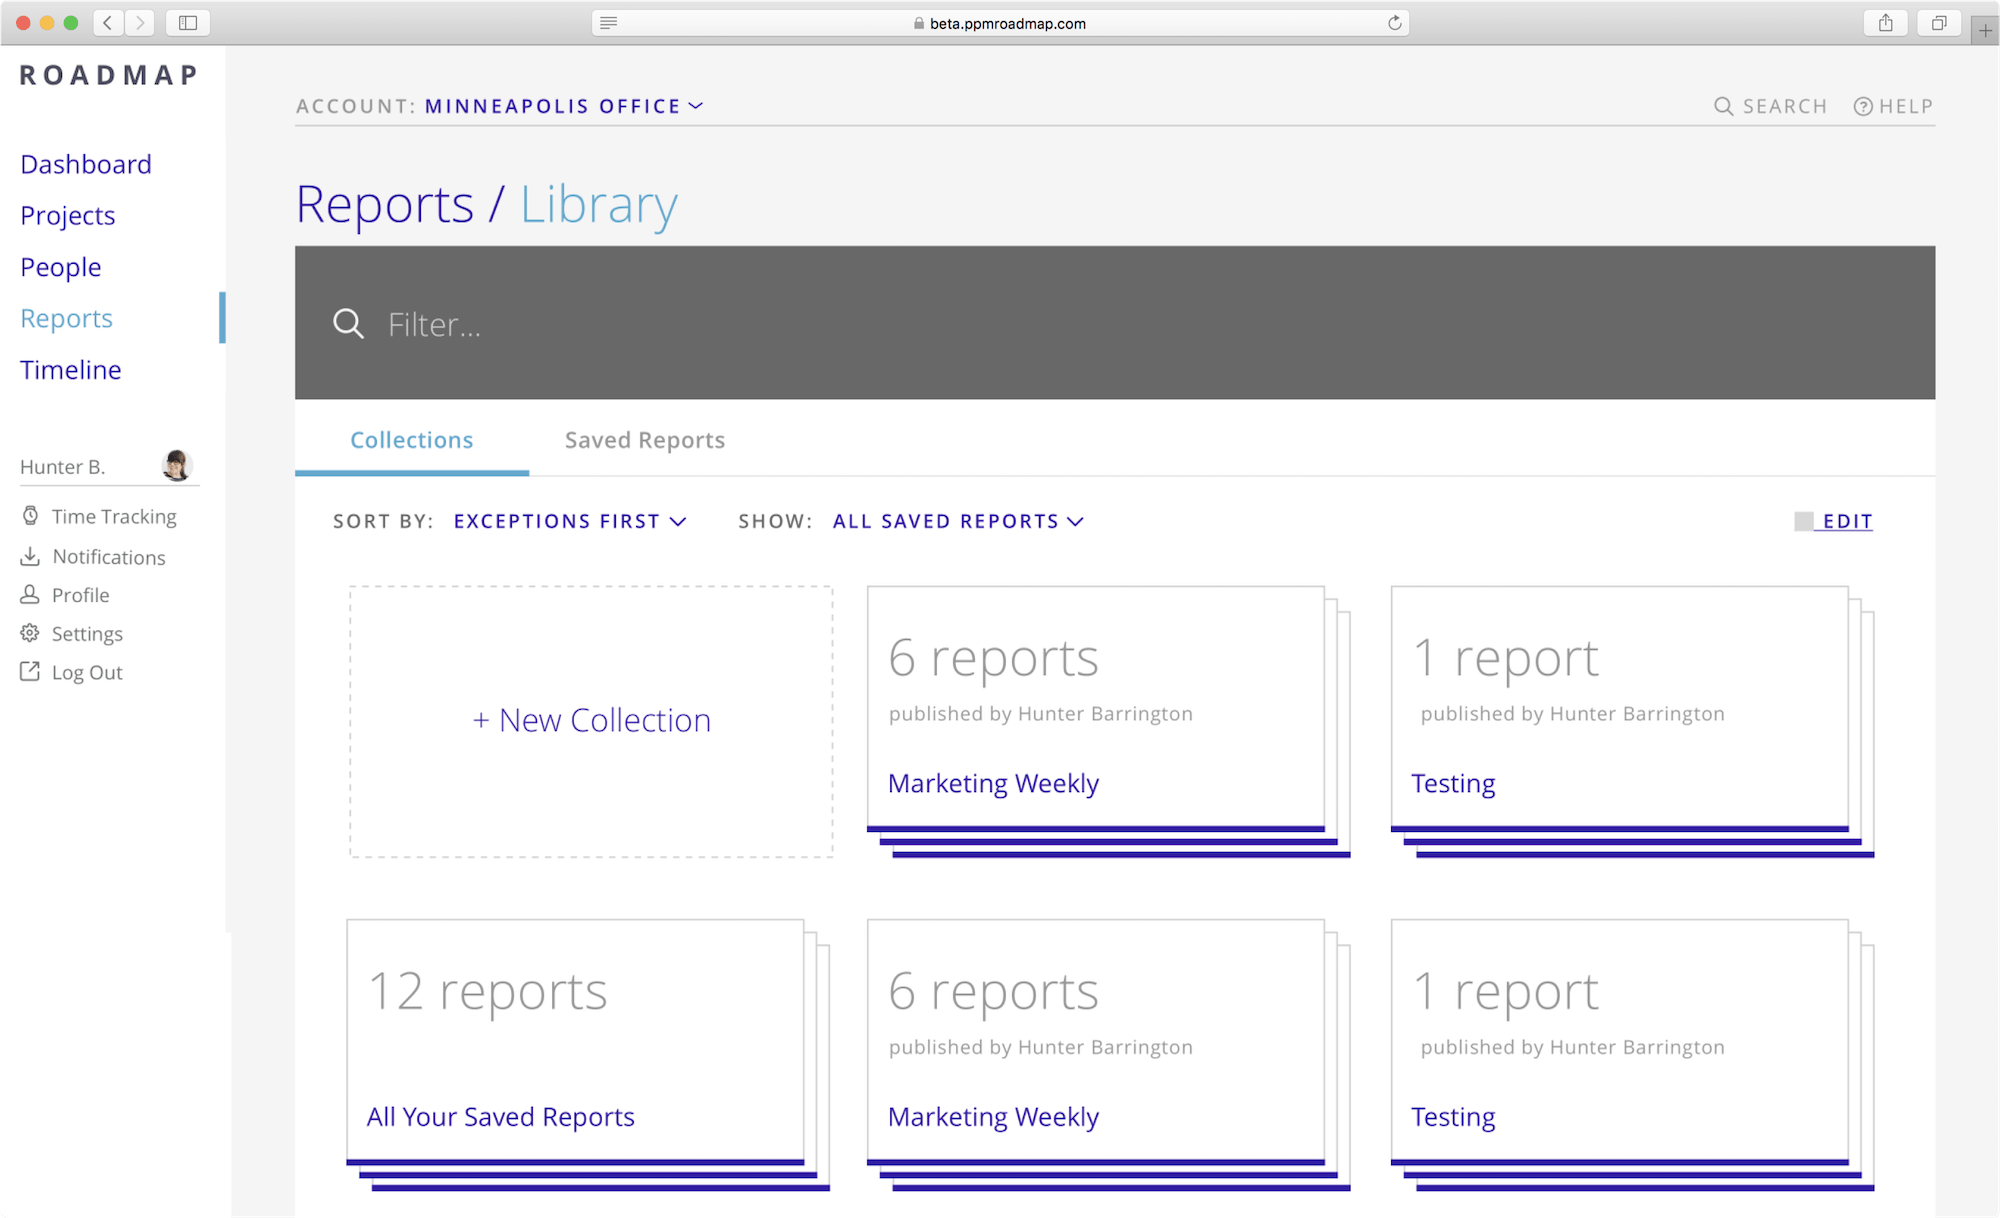
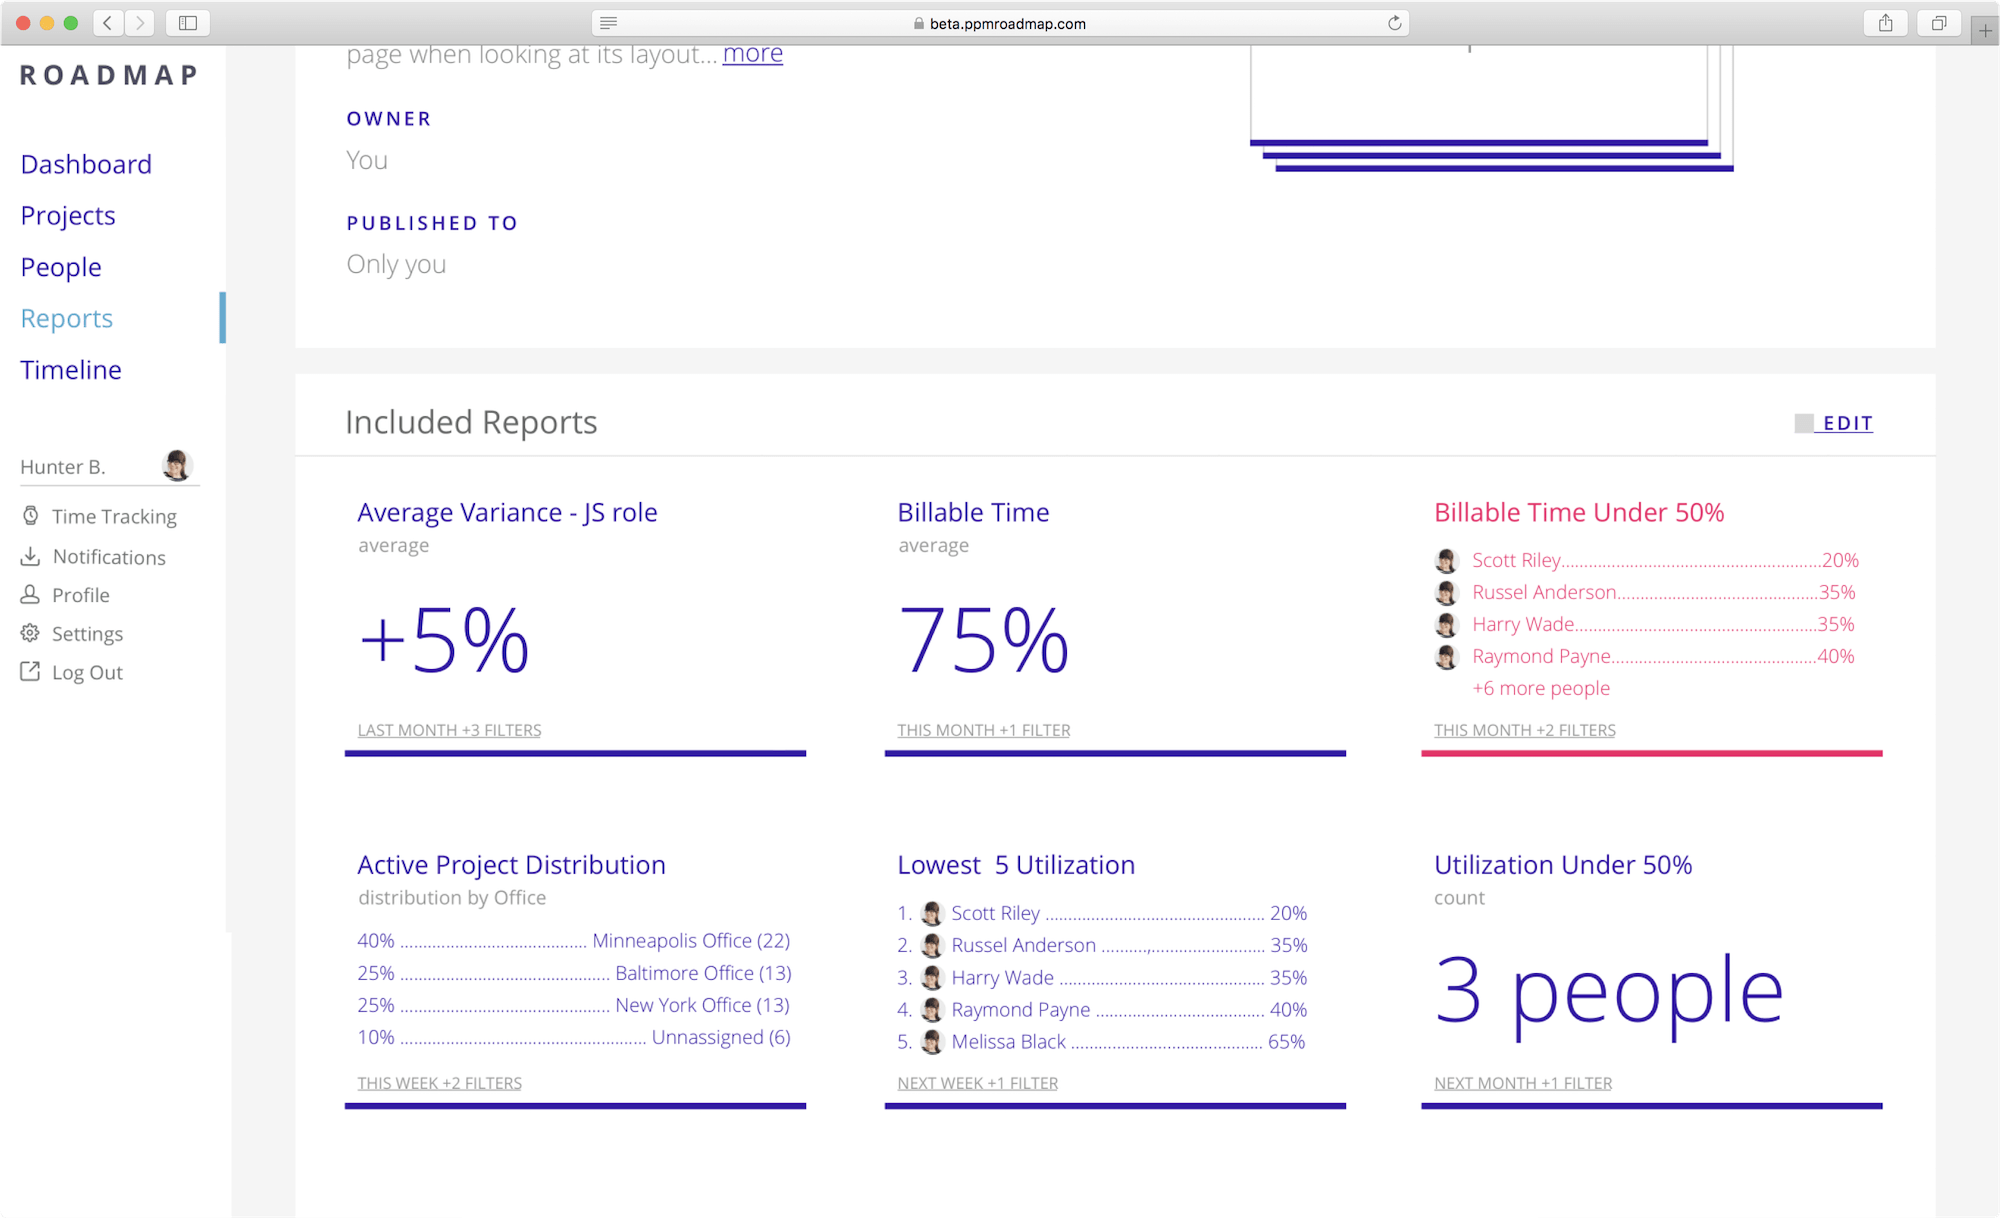
Collections
Saved Reports can be sorted into Collections and viewed with a targeted context, such as Weekly Meetings. Using collections gives some amount of context before clickthrough rather than wasting time browsing through data looking for what is relevant.

Dashboard
The dashboard displays the general health of a team’s progress, gives access to important status information, as well as provides easy access to pinned Collections. This allows Roadmap to be useful as a quick overview of each business day, rather than a chore or additional baggage.
Exceptions
Exceptions are contextually-chosen bounds for data in Roadmap. This helps a user direct their attention to problem areas, and helps prioritize decisions. For example, a project manager might only care about Utilization if it is under 75% or over 110%. A color-coded saved report can alert them to the issue, and they can drill-down to find and solve the problem.